How to: assign TF Motifs to ChIP-seq peaks
This tutorial demonstrates one way to assign CTCF motifs to CTCF ChIP-seq peaks using bioframe.
import matplotlib.pyplot as plt
import numpy as np
import pandas as pd

import bioframe
base_dir = "/tmp/bioframe_tutorial_data/"
assembly = "GRCh38"
Load CTCF ChIP-seq peaks for HFF from ENCODE
This approach makes use of the narrowPeak schema for bioframe.read_table .
ctcf_peaks = bioframe.read_table(
    "https://www.encodeproject.org/files/ENCFF401MQL/@@download/ENCFF401MQL.bed.gz",
    schema="narrowPeak",
)
ctcf_peaks[0:5]
| chrom | start | end | name | score | strand | fc | -log10p | -log10q | relSummit | |
|---|---|---|---|---|---|---|---|---|---|---|
| 0 | chr19 | 48309541 | 48309911 | . | 1000 | . | 5.04924 | -1.0 | 0.00438 | 185 |
| 1 | chr4 | 130563716 | 130564086 | . | 993 | . | 5.05052 | -1.0 | 0.00432 | 185 |
| 2 | chr1 | 200622507 | 200622877 | . | 591 | . | 5.05489 | -1.0 | 0.00400 | 185 |
| 3 | chr5 | 112848447 | 112848817 | . | 869 | . | 5.05841 | -1.0 | 0.00441 | 185 |
| 4 | chr1 | 145960616 | 145960986 | . | 575 | . | 5.05955 | -1.0 | 0.00439 | 185 |
Get CTCF motifs from JASPAR
### CTCF motif: http://jaspar.genereg.net/matrix/MA0139.1/
jaspar_url = "http://expdata.cmmt.ubc.ca/JASPAR/downloads/UCSC_tracks/2022/hg38/"
jaspar_motif_file = "MA0139.1.tsv.gz"
ctcf_motifs = bioframe.read_table(
    jaspar_url + jaspar_motif_file, schema="jaspar", skiprows=1
)
ctcf_motifs[0:4]
| chrom | start | end | name | score | pval | strand | |
|---|---|---|---|---|---|---|---|
| 0 | chr1 | 11163 | 11182 | CTCF | 811 | 406 | - |
| 1 | chr1 | 11222 | 11241 | CTCF | 959 | 804 | - |
| 2 | chr1 | 11280 | 11299 | CTCF | 939 | 728 | - |
| 3 | chr1 | 11339 | 11358 | CTCF | 837 | 455 | - |
Overlap peaks & motifs
df_peaks_motifs = bioframe.overlap(
    ctcf_peaks, ctcf_motifs, suffixes=("_1", "_2"), return_index=True
)
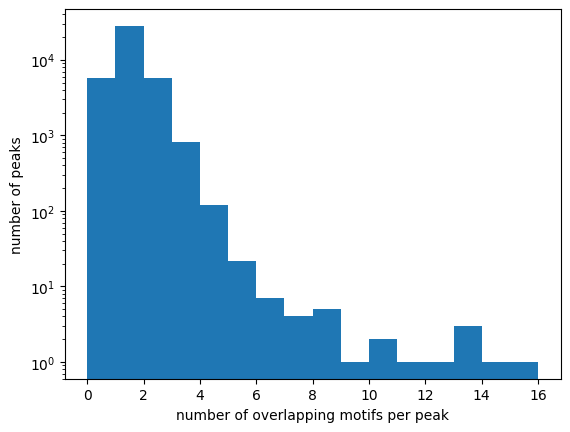
There are often multiple motifs overlapping one ChIP-seq peak, and a substantial number of peaks without motifs:
# note that counting motifs per peak can also be handled directly with
# bioframe.count_overlaps but since we re-use df_peaks_motifs below we
# instead use the pandas operations directly
motifs_per_peak = df_peaks_motifs.groupby(["index_1"])["index_2"].count().values

plt.hist(motifs_per_peak, np.arange(0, np.max(motifs_per_peak)))
plt.xlabel("number of overlapping motifs per peak")
plt.ylabel("number of peaks")
plt.semilogy()

print(
    f"fraction of peaks without motifs "
    f"{np.round(np.sum(motifs_per_peak == 0) / len(motifs_per_peak), 2)}"
)
fraction of peaks without motifs 0.14
Assign the strongest motif to each peak
# since idxmax does not currently take NA, fill with -1
df_peaks_motifs["pval_2"] = df_peaks_motifs["pval_2"].fillna(-1)
idxmax_peaks_motifs = (
    df_peaks_motifs.groupby(["chrom_1", "start_1", "end_1"])["pval_2"].idxmax().values
)
df_peaks_maxmotif = df_peaks_motifs.loc[idxmax_peaks_motifs]
df_peaks_maxmotif["pval_2"].replace(-1, np.nan, inplace=True)
/tmp/ipykernel_1360/2373793568.py:7: FutureWarning: A value is trying to be set on a copy of a DataFrame or Series through chained assignment using an inplace method.
The behavior will change in pandas 3.0. This inplace method will never work because the intermediate object on which we are setting values always behaves as a copy.

For example, when doing 'df[col].method(value, inplace=True)', try using 'df.method({col: value}, inplace=True)' or df[col] = df[col].method(value) instead, to perform the operation inplace on the original object.


  df_peaks_maxmotif["pval_2"].replace(-1, np.nan, inplace=True)
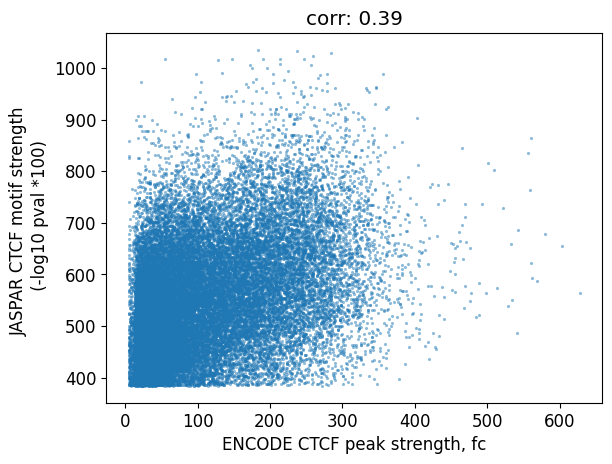
stronger peaks tend to have stronger motifs:
plt.rcParams["font.size"] = 12
df_peaks_maxmotif["fc_1"] = df_peaks_maxmotif["fc_1"].values.astype("float")
plt.scatter(
    df_peaks_maxmotif["fc_1"].values,
    df_peaks_maxmotif["pval_2"].values,
    5,
    alpha=0.5,
    lw=0,
)
plt.xlabel("ENCODE CTCF peak strength, fc")
plt.ylabel("JASPAR CTCF motif strength \n (-log10 pval *100)")
plt.title(
    "corr: "
    + str(np.round(df_peaks_maxmotif["fc_1"].corr(df_peaks_maxmotif["pval_2"]), 2))
);
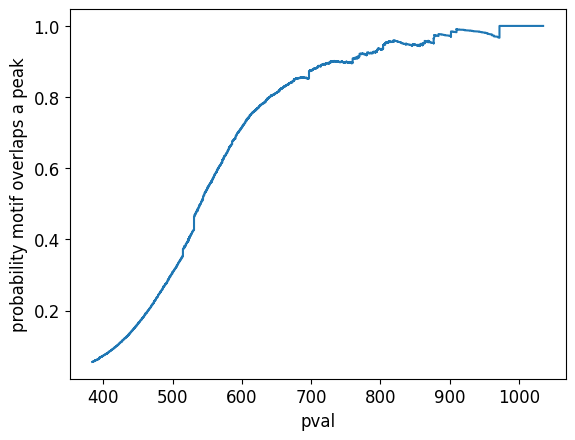
We can also ask the reverse question: how many motifs overlap a ChIP-seq peak?
df_motifs_peaks = bioframe.overlap(
    ctcf_motifs, ctcf_peaks, how="left", suffixes=("_1", "_2")
)
m = df_motifs_peaks.sort_values("pval_1")
plt.plot(
    m["pval_1"].values[::-1],
    np.cumsum(pd.isnull(m["chrom_2"].values[::-1]) == 0) / np.arange(1, len(m) + 1),
)
plt.xlabel("pval")
plt.ylabel("probability motif overlaps a peak");
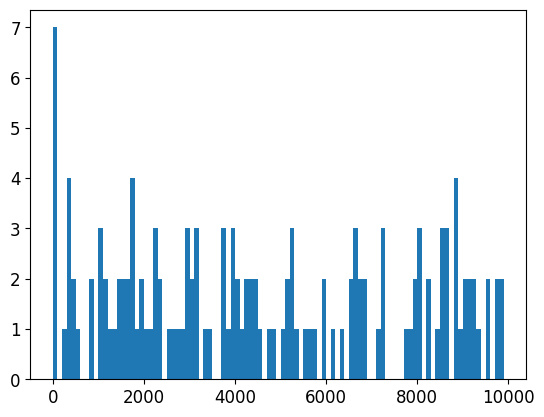
filter peaks overlapping blacklisted regions
do any of our peaks overlap blacklisted genomic regions?
blacklist = bioframe.read_table(
    "https://www.encodeproject.org/files/ENCFF356LFX/@@download/ENCFF356LFX.bed.gz",
    schema="bed3",
)
blacklist[0:3]
| chrom | start | end | |
|---|---|---|---|
| 0 | chr1 | 628903 | 635104 |
| 1 | chr1 | 5850087 | 5850571 |
| 2 | chr1 | 8909610 | 8910014 |
there appears to be a small spike in the number of peaks close to blacklist regions
closest_to_blacklist = bioframe.closest(ctcf_peaks, blacklist)
plt.hist(
    closest_to_blacklist["distance"].astype("Float64").astype("float"),
    np.arange(0, 1e4, 100),
);
to be safe, let’s remove anything +/- 1kb from a blacklisted region
# first let's select the columns we want for our final dataframe of peaks
# with motifs
df_peaks_maxmotif = df_peaks_maxmotif[
    [
        "chrom_1",
        "start_1",
        "end_1",
        "fc_1",
        "chrom_2",
        "start_2",
        "end_2",
        "pval_2",
        "strand_2",
    ]
]
#  then rename columns for convenience when subtracting
for i in df_peaks_maxmotif.keys():
    if "_1" in i:
        df_peaks_maxmotif.rename(columns={i: i.split("_")[0]}, inplace=True)

# now subtract, expanding the blacklist by 1kb
df_peaks_maxmotif_clean = bioframe.subtract(
    df_peaks_maxmotif, bioframe.expand(blacklist, 1000)
)
there it is! we now have a dataframe containing positions of CTCF ChIP peaks, including the strongest motif underlying that peak, and after conservative filtering for proximity to blacklisted regions
df_peaks_maxmotif_clean.iloc[7:15]
| chrom | start | end | fc | chrom_2 | start_2 | end_2 | pval_2 | strand_2 | |
|---|---|---|---|---|---|---|---|---|---|
| 7 | chr9 | 124777413 | 124777783 | 5.06479 | chr9 | 124777400 | 124777419 | 450.0 | + |
| 8 | chr1 | 67701045 | 67701415 | 5.06708 | None | <NA> | <NA> | NaN | None |
| 9 | chr10 | 119859586 | 119859956 | 5.08015 | chr10 | 119859591 | 119859610 | 611.0 | - |
| 10 | chr3 | 66816327 | 66816697 | 5.08233 | chr3 | 66816332 | 66816351 | 741.0 | - |
| 11 | chr16 | 50248791 | 50249161 | 5.08249 | None | <NA> | <NA> | NaN | None |
| 12 | chr19 | 41431677 | 41432047 | 5.11060 | chr19 | 41431802 | 41431821 | 477.0 | + |
| 13 | chr4 | 131644839 | 131645209 | 5.11204 | None | <NA> | <NA> | NaN | None |
| 14 | chr2 | 203239519 | 203239889 | 5.11817 | None | <NA> | <NA> | NaN | None |