Genomic interval operations
This guide provides an introdution into how to use bioframe to perform genomic interval operations. For the full list of genomic interval operations, see the API reference.
The following modules are used in this guide:
import itertools

import numpy as np
import matplotlib
import matplotlib.pyplot as plt
import pandas as pd

import bioframe as bf
import bioframe.vis
DataFrames & BedFrames
The core objects in bioframe are pandas DatFrames of genomic intervals, or BedFrames. These can either be defined directly with pandas.DataFrame:
df1 = pd.DataFrame([
    ['chr1', 1, 5],
    ['chr1', 3, 8],
    ['chr1', 8, 10],
    ['chr1', 12, 14]],
    columns=['chrom', 'start', 'end']
)
Or via functions in bioframe.core.construction, e.g.:
df2 = bioframe.from_any(
    [['chr1', 4, 8],
     ['chr1', 10, 11]],
    name_col='chrom')
Or ingested from datasets and databases with functions in bioframe.io.fileops and bioframe.io.resources.
BedFrames satisfy the following properties:
chrom, start, end columns
columns have valid dtypes (object/string/categorical, int/pd.Int64Dtype(), int/pd.Int64Dtype())
for each interval, if any of chrom, start, end are null, then all are null
all starts <= ends.
Whether a dataframe satisfies these properties can be checked with bioframe.core.checks.is_bedframe():
bioframe.is_bedframe(df2)
True
See bioframe.core.checks for other functions that test properties of BedFrames and Technical Notes for detailed definitions.
bioframe.core.construction.sanitize_bedframe() attempts to modfiy a DataFrame such that it satisfies bedFrame requirements.
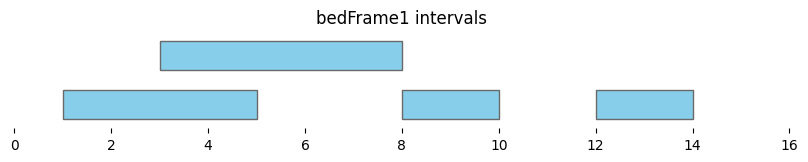
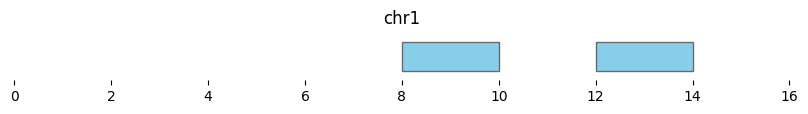
bioframe.vis provides plotting utilities for intervals:
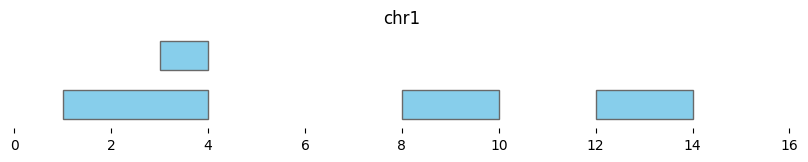
bf.vis.plot_intervals(df1, show_coords=True, xlim=(0,16))
plt.title('bedFrame1 intervals');
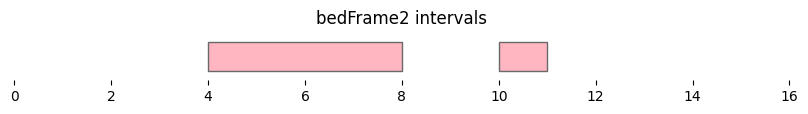
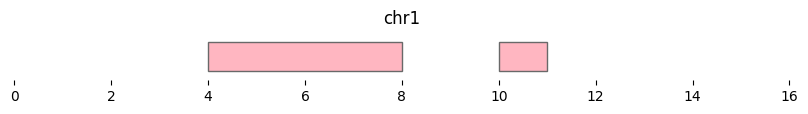
bf.vis.plot_intervals(df2, show_coords=True, xlim=(0,16), colors='lightpink')
plt.title('bedFrame2 intervals');
Overlap
Calculating the overlap between two sets of genomic intervals is a crucial genomic interval operation.
Using bioframe.overlap(), we can see the two dataframes defined above, df1 and df2, contain two pairs of overlapping intervals:
overlapping_intervals = bf.overlap(df1, df2, how='inner', suffixes=('_1','_2'))
display(overlapping_intervals)
| chrom_1 | start_1 | end_1 | chrom_2 | start_2 | end_2 | |
|---|---|---|---|---|---|---|
| 0 | chr1 | 1 | 5 | chr1 | 4 | 8 |
| 1 | chr1 | 3 | 8 | chr1 | 4 | 8 |
for i, reg_pair in overlapping_intervals.iterrows():
    bf.vis.plot_intervals_arr(
        starts = [reg_pair.start_1,reg_pair.start_2],
        ends = [reg_pair.end_1,reg_pair.end_2],
        colors = ['skyblue', 'lightpink'],
        levels = [2,1],
        xlim = (0,16),
        show_coords = True)
    plt.title(f'overlapping pair #{i}')


Note that we passed custom suffixes for the outputs (defaults are suffixes=("","_")),
as well as a custom overlap mode (how='inner'). The default overlap mode, how='left' returns each interval in df1 whether or not it overlaps an interval in df2.
overlapping_intervals = bf.overlap(df1, df2)
display(overlapping_intervals)
| chrom | start | end | chrom_ | start_ | end_ | |
|---|---|---|---|---|---|---|
| 0 | chr1 | 1 | 5 | chr1 | 4 | 8 |
| 1 | chr1 | 3 | 8 | chr1 | 4 | 8 |
| 2 | chr1 | 8 | 10 | None | <NA> | <NA> |
| 3 | chr1 | 12 | 14 | None | <NA> | <NA> |
Cluster
It is often useful to find overlapping intervals within a single set of genomic intervals. In bioframe, this is achieved with bioframe.cluster(). This function returns a DataFrame where subsets of overlapping intervals are assigned to the same group, reported in a new column.
To demonstrate the usage of bioframe.cluster(), we use the same df1 as above:
df1 = pd.DataFrame([
['chr1', 1, 5],
['chr1', 3, 8],
['chr1', 8, 10],
['chr1', 12, 14],
],
columns=['chrom', 'start', 'end']
)
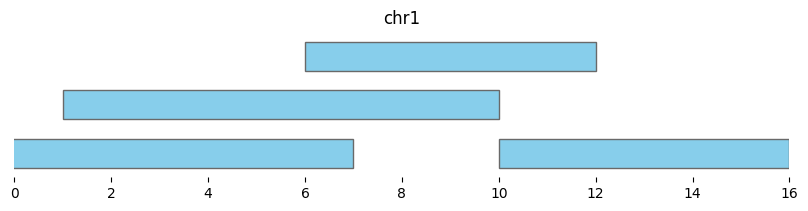
bf.vis.plot_intervals(df1, show_coords=True, xlim=(0,16))

Cluster returns a DataFrame where each interval is assigned to a group:
df_annotated = bf.cluster(df1, min_dist=0)
display(df_annotated)
bf.vis.plot_intervals(df_annotated, labels=df_annotated['cluster'], show_coords=True, xlim=(0,16))
| chrom | start | end | cluster | cluster_start | cluster_end | |
|---|---|---|---|---|---|---|
| 0 | chr1 | 1 | 5 | 0 | 1 | 10 |
| 1 | chr1 | 3 | 8 | 0 | 1 | 10 |
| 2 | chr1 | 8 | 10 | 0 | 1 | 10 |
| 3 | chr1 | 12 | 14 | 1 | 12 | 14 |
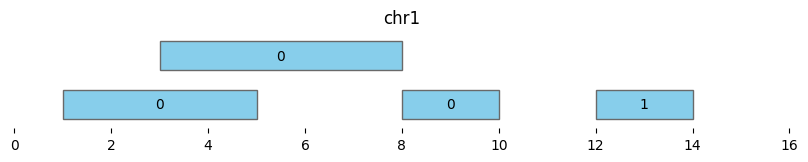
Note that using min_dist=0 and min_dist=None give different results, as the latter only clusters overlapping intervals and not adjacent intervals:
df_annotated = bf.cluster(df1, min_dist=None)
display(df_annotated)
bf.vis.plot_intervals(df_annotated, labels=df_annotated['cluster'], show_coords=True, xlim=(0,16))
| chrom | start | end | cluster | cluster_start | cluster_end | |
|---|---|---|---|---|---|---|
| 0 | chr1 | 1 | 5 | 0 | 1 | 8 |
| 1 | chr1 | 3 | 8 | 0 | 1 | 8 |
| 2 | chr1 | 8 | 10 | 1 | 8 | 10 |
| 3 | chr1 | 12 | 14 | 2 | 12 | 14 |

Extending the minimum distance to two (min_dist=2) makes all intervals part of the same cluster “0”:
df_annotated = bf.cluster(df1, min_dist=2)
display(df_annotated)
bf.vis.plot_intervals(df_annotated, labels=df_annotated['cluster'], show_coords=True, xlim=(0,16))
| chrom | start | end | cluster | cluster_start | cluster_end | |
|---|---|---|---|---|---|---|
| 0 | chr1 | 1 | 5 | 0 | 1 | 14 |
| 1 | chr1 | 3 | 8 | 0 | 1 | 14 |
| 2 | chr1 | 8 | 10 | 0 | 1 | 14 |
| 3 | chr1 | 12 | 14 | 0 | 1 | 14 |

Merge
Instead of returning cluster assignments, bioframe.merge() returns a new dataframe of merged genomic intervals. As with bioframe.cluster(), using min_dist=0 and min_dist=None gives different results.
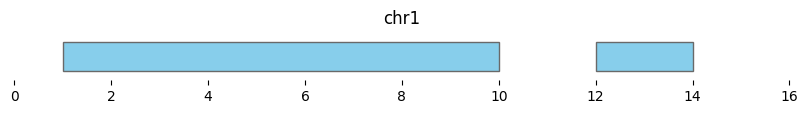
If min_dist=0, this returns a dataframe of two intervals:
df_merged = bf.merge(df1, min_dist=0)

display(df_merged)
bf.vis.plot_intervals(df_merged, show_coords=True, xlim=(0,16))
| chrom | start | end | n_intervals | |
|---|---|---|---|---|
| 0 | chr1 | 1 | 10 | 3 |
| 1 | chr1 | 12 | 14 | 1 |
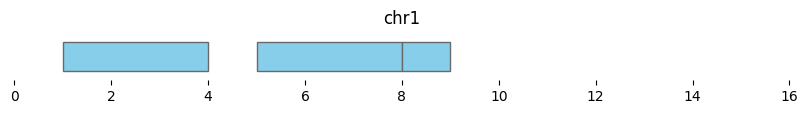
If min_dist=None, this returns a dataframe of three intervals:
df_merged = bf.merge(df1, min_dist=None)
display(df_merged)
bf.vis.plot_intervals(df_merged, show_coords=True, xlim=(0,16))
| chrom | start | end | n_intervals | |
|---|---|---|---|---|
| 0 | chr1 | 1 | 8 | 2 |
| 1 | chr1 | 8 | 10 | 1 |
| 2 | chr1 | 12 | 14 | 1 |

Closest
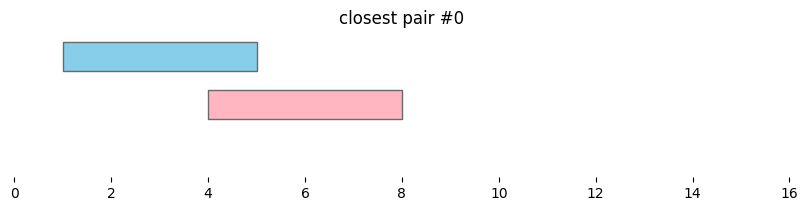
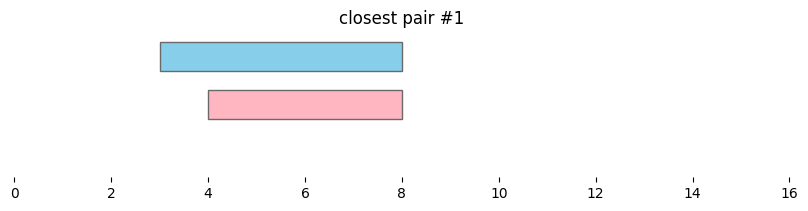
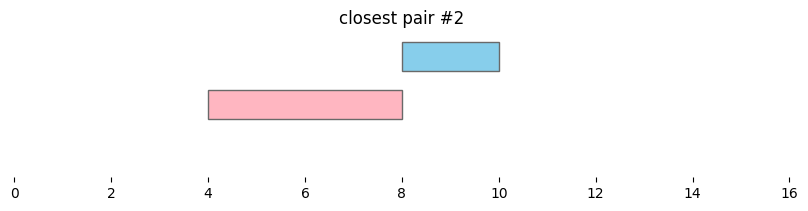
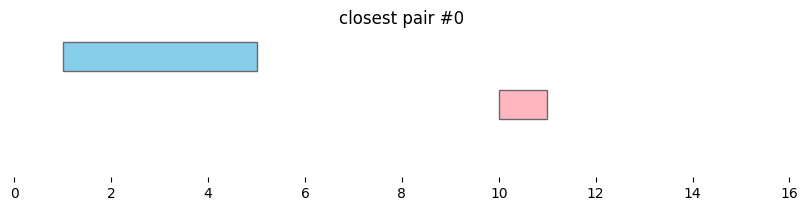
In genomics, it is often useful not only to find features that overlap, but also features that are nearby along the genome. In bioframe, this is achieved using bioframe.closest().
closest_intervals = bf.closest(df1, df2, suffixes=('_1','_2'))
display(closest_intervals)
| chrom_1 | start_1 | end_1 | chrom_2 | start_2 | end_2 | distance | |
|---|---|---|---|---|---|---|---|
| 0 | chr1 | 1 | 5 | chr1 | 4 | 8 | 0 |
| 1 | chr1 | 3 | 8 | chr1 | 4 | 8 | 0 |
| 2 | chr1 | 8 | 10 | chr1 | 4 | 8 | 0 |
| 3 | chr1 | 12 | 14 | chr1 | 10 | 11 | 1 |
for i, reg_pair in closest_intervals.iterrows():
    bf.vis.plot_intervals_arr(
        starts = [reg_pair.start_1,reg_pair.start_2],
        ends = [reg_pair.end_1,reg_pair.end_2],
        colors = ['skyblue', 'lightpink'],
        levels = [2,1],
        xlim = (0,16),
        show_coords = True)
    plt.title(f'closest pair #{i}')
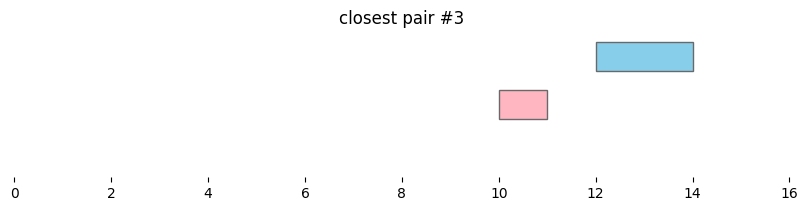
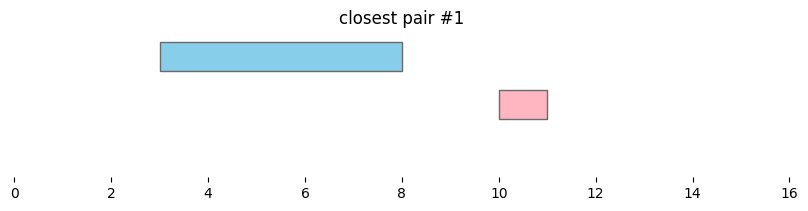
By default, bioframe.closest() reports overlapping intervals. This can be modified by passing ignore_overlap=True. Note the closest pair #2 and #3, which did not overlap, remain the same:
closest_intervals = bf.closest(df1, df2, ignore_overlaps=True, suffixes=('_1','_2'))
for i, reg_pair in closest_intervals.iterrows():
    bf.vis.plot_intervals_arr(
        starts = [reg_pair.start_1,reg_pair.start_2],
        ends = [reg_pair.end_1,reg_pair.end_2],
        colors = ['skyblue', 'lightpink'],
        levels = [2,1],
        xlim = (0,16),
        show_coords = True)
    plt.title(f'closest pair #{i}')
Closest intervals within a single DataFrame can be found simply by passing a single dataframe to bioframe.closest(). The number of closest intervals to report per query interval can be adjusted with k.
bf.closest(df1, k=2)
| chrom | start | end | chrom_ | start_ | end_ | distance | |
|---|---|---|---|---|---|---|---|
| 0 | chr1 | 1 | 5 | chr1 | 3 | 8 | 0 |
| 1 | chr1 | 1 | 5 | chr1 | 8 | 10 | 3 |
| 2 | chr1 | 3 | 8 | chr1 | 1 | 5 | 0 |
| 3 | chr1 | 3 | 8 | chr1 | 8 | 10 | 0 |
| 4 | chr1 | 8 | 10 | chr1 | 3 | 8 | 0 |
| 5 | chr1 | 8 | 10 | chr1 | 12 | 14 | 2 |
| 6 | chr1 | 12 | 14 | chr1 | 8 | 10 | 2 |
| 7 | chr1 | 12 | 14 | chr1 | 3 | 8 | 4 |
Closest intervals upstream of the features in df1 can be found by ignoring downstream and overlaps. Upstream/downstream direction is defined by genomic coordinates by default (smaller coordinate is upstream).
bf.closest(df1, df2,
    ignore_overlaps=True,
    ignore_downstream=True)
| chrom | start | end | chrom_ | start_ | end_ | distance | |
|---|---|---|---|---|---|---|---|
| 0 | chr1 | 8 | 10 | chr1 | 4 | 8 | 0 |
| 1 | chr1 | 12 | 14 | chr1 | 10 | 11 | 1 |
| 2 | chr1 | 1 | 5 | <NA> | <NA> | <NA> | <NA> |
| 3 | chr1 | 3 | 8 | <NA> | <NA> | <NA> | <NA> |
If the features in df1 have direction (e.g., genes have transcription direction), then the definition of upstream/downstream direction can be changed to the direction of the features by direction_col:
df1["strand"] = np.where(np.random.rand(len(df1)) > 0.5, "+", "-")
bf.closest(df1, df2,
    ignore_overlaps=True,
    ignore_downstream=True,
    direction_col='strand')
| chrom | start | end | strand | chrom_ | start_ | end_ | distance | |
|---|---|---|---|---|---|---|---|---|
| 0 | chr1 | 1 | 5 | - | chr1 | 10 | 11 | 5 |
| 1 | chr1 | 8 | 10 | + | chr1 | 4 | 8 | 0 |
| 2 | chr1 | 3 | 8 | + | <NA> | <NA> | <NA> | <NA> |
| 3 | chr1 | 12 | 14 | - | <NA> | <NA> | <NA> | <NA> |
Coverage & Count Overlaps
For two sets of genomic features, it is often useful to calculate the number of basepairs covered and the number of overlapping intervals. While these are fairly straightforward to compute from the output of bioframe.overlap() with pandas.groupby() and column renaming, since these are very frequently used, they are provided as core bioframe functions.
df1_coverage = bf.coverage(df1, df2)
display(df1_coverage)
| chrom | start | end | strand | coverage | |
|---|---|---|---|---|---|
| 0 | chr1 | 1 | 5 | - | 1 |
| 1 | chr1 | 3 | 8 | + | 4 |
| 2 | chr1 | 8 | 10 | + | 0 |
| 3 | chr1 | 12 | 14 | - | 0 |
df1_coverage_and_count = bf.count_overlaps(df1_coverage, df2)
display(df1_coverage_and_count)
| chrom | start | end | strand | coverage | count | |
|---|---|---|---|---|---|---|
| 0 | chr1 | 1 | 5 | - | 1 | 1 |
| 1 | chr1 | 3 | 8 | + | 4 | 1 |
| 2 | chr1 | 8 | 10 | + | 0 | 0 |
| 3 | chr1 | 12 | 14 | - | 0 | 0 |
This plot shows the coverage and number of overlaps for intervals in df1 by df2:
bf.vis.plot_intervals(
    df1_coverage_and_count,
    show_coords=True, xlim=(0,16),
    labels = [f'{cov} bp, {n} intervals'
              for cov, n in zip(df1_coverage_and_count.coverage, df1_coverage_and_count['count'])])

bf.vis.plot_intervals(df2, show_coords=True, xlim=(0,16), colors='lightpink')

Subtract & Set Difference
Bioframe has two functions for computing differences between sets of intervals: at the level of basepairs and at the level of whole intervals.
Basepair-level subtraction is performed with bioframe.subtract():
subtracted_intervals = bf.subtract(df1, df2)
display(subtracted_intervals)
| chrom | start | end | strand | |
|---|---|---|---|---|
| 0 | chr1 | 1 | 4 | - |
| 1 | chr1 | 3 | 4 | + |
| 2 | chr1 | 8 | 10 | + |
| 3 | chr1 | 12 | 14 | - |
bf.vis.plot_intervals(subtracted_intervals, show_coords=True, xlim=(0,16))
Interval-level differences are calculated with bioframe.setdiff():
setdiff_intervals = bf.setdiff(df1, df2)
display(setdiff_intervals)
| chrom | start | end | strand | |
|---|---|---|---|---|
| 2 | chr1 | 8 | 10 | + |
| 3 | chr1 | 12 | 14 | - |
bf.vis.plot_intervals(setdiff_intervals, show_coords=True, xlim=(0,16))
Expand
bioframe.expand() enables quick resizing of intervals.
Expand supports additive resizing, with pad.
Note that unless subsequently trimmed (with bioframe.trim()),
expanded intervals can have negative values:
expanded_intervals = bf.expand(df1, pad=2)
display(expanded_intervals)
| chrom | start | end | strand | |
|---|---|---|---|---|
| 0 | chr1 | -1 | 7 | - |
| 1 | chr1 | 1 | 10 | + |
| 2 | chr1 | 6 | 12 | + |
| 3 | chr1 | 10 | 16 | - |
bf.vis.plot_intervals(expanded_intervals, show_coords=True, xlim=(0,16))
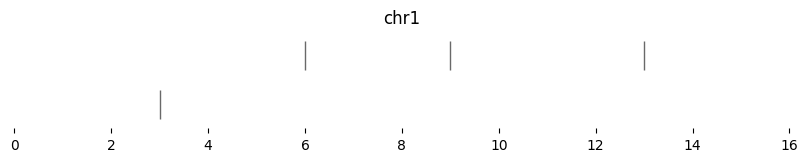
Expand also supports multiplicative resizing, with scale. Note that scale=0 resizes all intervals to their midpoints:
expanded_intervals = bf.expand(df1, scale=0)
display(expanded_intervals)
| chrom | start | end | strand | |
|---|---|---|---|---|
| 0 | chr1 | 3 | 3 | - |
| 1 | chr1 | 6 | 6 | + |
| 2 | chr1 | 9 | 9 | + |
| 3 | chr1 | 13 | 13 | - |
bf.vis.plot_intervals(expanded_intervals, show_coords=True, xlim=(0,16))
Genomic Views
Certain interval operations are often used relative to a set of reference intervals, whether those are chromosomes, scaffolds, or sub-intervals of either. Bioframe formalizes this with the concept of a genomic view, implemented as pandas dataframes, termed viewFrames, that satisfy the following:
all requirements for bedFrames, including columns for (‘chrom’, ‘start’, ‘end’)
it has an additional column,
view_name_col, with default ‘name’entries in the view_name_col are unique
intervals are non-overlapping
it does not contain null values
Importanly a genomic view specifies a global coordinate axis, i.e. a conversion from a genomic coordinate system to a single axis. See Technical Notes for more details.
Bioframe provides a function to assign intervals to corresponding intervals in a view, bioframe.assign_view(), a function to construct views from various input formats, bioframe.core.construction.make_viewframe(), and a function check that viewframe requirements are met, bioframe.core.checks.is_viewframe().
The following genomic interval operations make use of views, though also have useful default behavior if no view is provided: bioframe.complement(), bioframe.trim(), bioframe.sort_bedframe().
Complement
Equally important to finding which genomic features overlap is finding those that do not. bioframe.complement() returns a BedFrame of intervals not covered by any intervals in an input BedFrame.
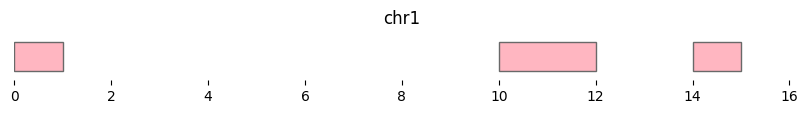
Complments are defined relative to a genomic view. Here this is provided as a dictionary with a single chromosome of length 15:
df_complemented = bf.complement(df1, view_df={'chr1':15})
display(df_complemented)
| chrom | start | end | view_region | |
|---|---|---|---|---|
| 0 | chr1 | 0 | 1 | chr1 |
| 1 | chr1 | 10 | 12 | chr1 |
| 2 | chr1 | 14 | 15 | chr1 |
bf.vis.plot_intervals(df_complemented, show_coords=True, xlim=(0,16), colors='lightpink')
If no view is provided, complement is calculated per unique chromosome in the input with right limits of np.iinfo(np.int64).max.
df_complemented = bf.complement(df1)
display(df_complemented)
| chrom | start | end | view_region | |
|---|---|---|---|---|
| 0 | chr1 | 0 | 1 | chr1 |
| 1 | chr1 | 10 | 12 | chr1 |
| 2 | chr1 | 14 | 9223372036854775807 | chr1 |
Trim
Certain regions are often best avoided for genomic analyses. bioframe.trim() trims intervals to a specified view. Intervals falling outside of view regions have their filled with null values.
view_df = pd.DataFrame(
    [
        ["chr1", 0, 4, "chr1p"],
        ["chr1", 5, 9, "chr1q"],
        ["chrX", 0, 50, "chrX"],
        ["chrM", 0, 10, "chrM"]],
    columns=["chrom", "start", "end", "name"],
)

trimmed_intervals = bf.trim(df1, view_df)
display(trimmed_intervals)
| chrom | start | end | strand | |
|---|---|---|---|---|
| 0 | chr1 | 1.0 | 4.0 | - |
| 1 | chr1 | 5.0 | 8.0 | + |
| 2 | chr1 | 8.0 | 9.0 | + |
| 3 | <NA> | NaN | NaN | - |
Note that the last interval of df1 fell beyond ‘chr1q’ and is now null, and the last interval now ends at 9 instead of 10.
bf.vis.plot_intervals(trimmed_intervals, show_coords=True, xlim=(0,16))
If no view is provided, this function trims intervals at zero to avoid negative values.
Sorting
If no view is provided, bioframe.sort_bedframe() sorts by (“chrom”, “start”, “end”) columns:
df_unsorted = pd.DataFrame([
    ['chrM', 3, 8],
    ['chrM', 1, 5],
    ['chrX', 12, 14],
    ['chrX', 8, 10]],
    columns=['chrom', 'start', 'end']
)

display( bf.sort_bedframe(df_unsorted) )
| chrom | start | end | |
|---|---|---|---|
| 0 | chrM | 1 | 5 |
| 1 | chrM | 3 | 8 |
| 2 | chrX | 8 | 10 |
| 3 | chrX | 12 | 14 |
Views enable a specifying a sort order on a set of intervals. This flexibility is useful when the desired sorting order is non-lexicographical, e.g. with chrM after autosomes and chrX:
display( bf.sort_bedframe(df_unsorted, view_df) )
| chrom | start | end | |
|---|---|---|---|
| 0 | chrX | 8 | 10 |
| 1 | chrX | 12 | 14 |
| 2 | chrM | 1 | 5 |
| 3 | chrM | 3 | 8 |
Selecting & Slicing
Since bioFrame operates directly with pandas DataFrames, all typical selection and slicing operations are directly relevant.
Bioframe also provides a function bioframe.select() that enables selecting interval subsets using UCSC string format:
display( bioframe.select(df_unsorted,'chrX:8-14') )
| chrom | start | end | |
|---|---|---|---|
| 2 | chrX | 12 | 14 |
| 3 | chrX | 8 | 10 |
Flexible column naming
Genomic analyses often deal with dataframes with inhomogeneously named columns. Bioframe offers a way to set the default column names that are most convenient for your analyses.
Default bedframe column names are stored in bioframe.core.specs_rc.
bf.core.specs._rc
{'colnames': {'chrom': 'chrom', 'start': 'start', 'end': 'end'}}
If the dataframes we wish to work with have ['CHROMOSOME', 'LEFT', 'RIGHT'], we can either pass cols to operations in bioframe.ops:
df1_diff_colnames = pd.DataFrame([
    ['chr1', 1, 5],
    ['chr1', 3, 8]],
    columns=['CHROMOSOME', 'LEFT', 'RIGHT']
)

df2_diff_colnames = pd.DataFrame([
    ['chr1', 4, 8],
    ['chr1', 10, 11]],
    columns=['CHROMOSOME', 'LEFT', 'RIGHT']
)
bf.overlap(
    df1_diff_colnames, df2_diff_colnames,
    cols1=['CHROMOSOME', 'LEFT', 'RIGHT'],
    cols2=['CHROMOSOME', 'LEFT', 'RIGHT'],
)
| CHROMOSOME | LEFT | RIGHT | CHROMOSOME_ | LEFT_ | RIGHT_ | |
|---|---|---|---|---|---|---|
| 0 | chr1 | 1 | 5 | chr1 | 4 | 8 |
| 1 | chr1 | 3 | 8 | chr1 | 4 | 8 |
Or, we can update the default column names:
with bf.core.specs.update_default_colnames(['CHROMOSOME', 'LEFT', 'RIGHT']):
    display(bf.overlap(
        df1_diff_colnames, df2_diff_colnames,
    ))
| CHROMOSOME | LEFT | RIGHT | CHROMOSOME_ | LEFT_ | RIGHT_ | |
|---|---|---|---|---|---|---|
| 0 | chr1 | 1 | 5 | chr1 | 4 | 8 |
| 1 | chr1 | 3 | 8 | chr1 | 4 | 8 |
# setting colnames back to default.
bf.core.specs.update_default_colnames(['chrom', 'start', 'end'])
bf.core.specs._rc
{'colnames': {'chrom': 'chrom', 'start': 'start', 'end': 'end'}}